Is the American Stock Market Overvalued?
This page reports on a daily updated valuation model of the US stock market. The model estimates the long-run equilibrium between market capitalization and cyclically adjusted corporate earnings.
Market capitalization versus the long-run equilibrium
The plot compares logged total market capitalization to long-run equilibrium levels (estimated from cyclically adjusted corporate earnings).
The American stock market currently appears to be overvalued by 73%. In other words, it would take a 42% drop to bring the market back to its long-run equilibrium level. In comparison, at the peak of the Dot-com bubble, on March 24, 2000, the market was 87.9% overvalued. When the market bottomed out 2.5 years later, it had dropped 50.2% from its previous all-time high and was undervalued by 21.5%.
These estimates are based on a model inspired by Shiller’s cyclically adjusted price-to-earnings ratio (CAPE). We find the CAPE measure preferable to the market cap-to-GNP ratio, as it accounts for long-term changes in the ratio of corporate profits to GNP. Our model estimates the long-run equilibrium between stock market capitalization and cyclically adjusted corporate earnings.
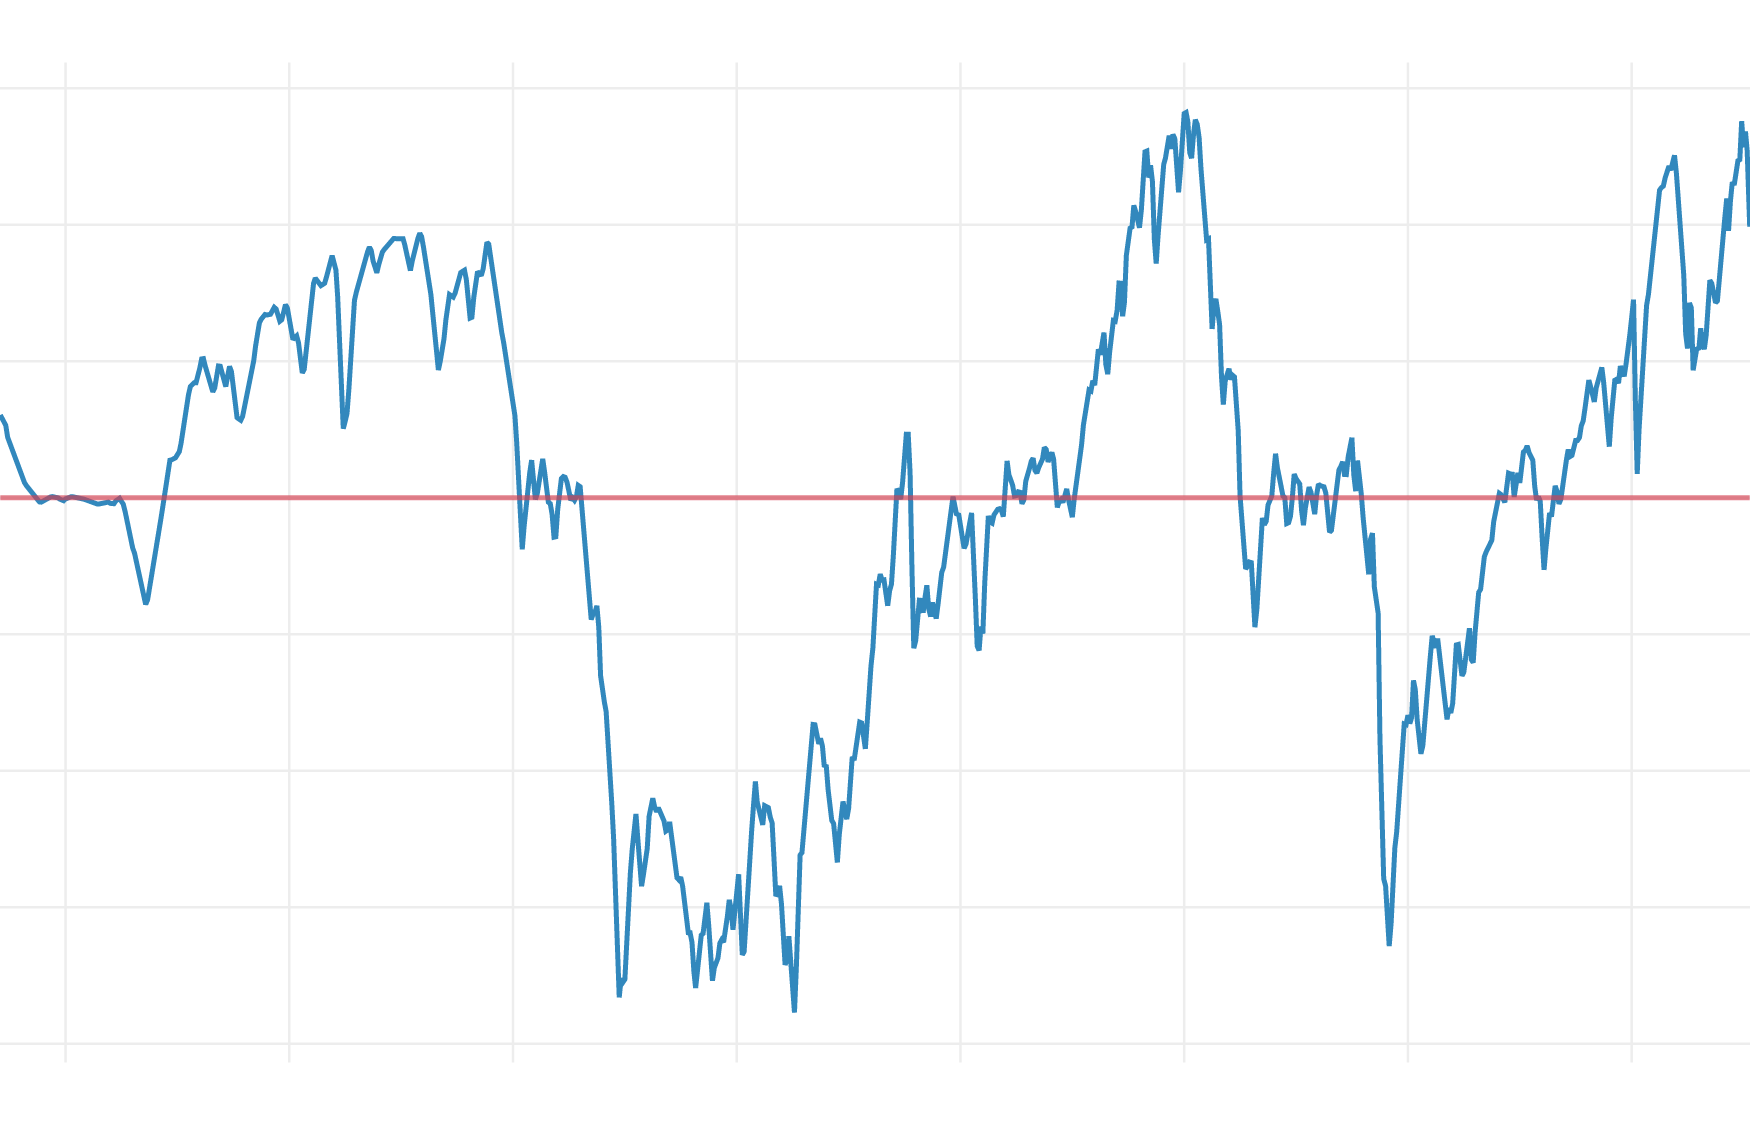
Deviations from the long-run equilibrium
The plot shows how logged total market capitalization has deviated from the long-run equilibrium level over time.
The fact that the market currently appears overvalued does not necessarily mean it will correct back any time soon. The forces pulling the market toward the long-run equilibrium are relatively weak and allow the market to stay over- or undervalued for extended periods of time: From 1954 to 1970, the market stayed continuously overvalued for over 15 years, and from 1973 until 1987, it stayed undervalued for about 14 years.
Do valuation levels tell us anything about expected future returns? The historical data suggest the answer is “no” in the short term and “yes” in the long term: As the plot below illustrates, current valuation levels have very little predictive power if we look at market returns one year ahead. However, with a ten-year time horizon, valuation levels predict about 80% of the variation in total returns.
Valuation levels and subsequent returns
The plot shows nominal returns over stock market valuations for the period 1971-2022. The valuations are calculated as differences between logged total market capitalization and the long-run equilibrium level. The returns are not adjusted for inflation.
The price at which one enters the market has a significant effect on long-run returns. Entering the market when it is undervalued by -.5 on the logged scale, one can on average expect a real return of 190.9% over the next ten years. This would be similar to buying near the bottom after the 2007–2008 financial crisis. Entering the market at the long-run equilibrium price, one can on average expect a real return of 93.5% over the next ten years. In contrast, entering the market at current prices, one can on average expect a real return of 23.6% over the next ten years, which implies an annualized real return of 2.1%. The probability of seeing negative real returns after ten years is currently 25.7%.
Predicted real returns for different entry points
The plot shows ten years of predicted real total returns for investments made at different valution levels. The valuations are calculated as differences between logged total market capitalization and the long-run equilibrium level. The returns are adjusted for inflation.