The 2021 Norwegian Parliamentary Election
This page offered daily updated predictions for the 2021 Norwegian parliamentary election. It has now been archived, but remains publicly available.
How popular are the competing blocks?
The plot shows weekly levels of support in the form of predicted vote shares. To view detailed results for a specific week, move the marker over the plot (on touch screens: tap). The weeks are identified by the Monday on which they start. Uncertainty is illustrated by 90% prediction intervals.
The vote share of the conservative block is expected to lie between 37.1 and 41.7% with a 90% probability. The Labor Party (Ap), the Centre Party (Sp), and the Socialist Left Party (SV) are expected to receive between 44.3 and 49.1% of the votes. Adding the Green Party and the Red Party yields an expected vote share of 53.7 and 58.4%.
Who will win a parliamentary majority?
The plot shows the probability that a party constellation would get a majority if an election had been held during a given week.
The conservative block currently has a less than 5% probability of winning a parliamentary majority at the next election. The equivalent probability for a coalition consisting of the Labor Party (Ap) and the Centre Party (Sp) is also less than 5%. Adding the Socialist Left Party (SV) to the coalition increases the probability to 85.3%. Removing the Centre Party from the coalition and adding the Green Party (MDG) and the Red Party (R) yields a probability of less than 5%.
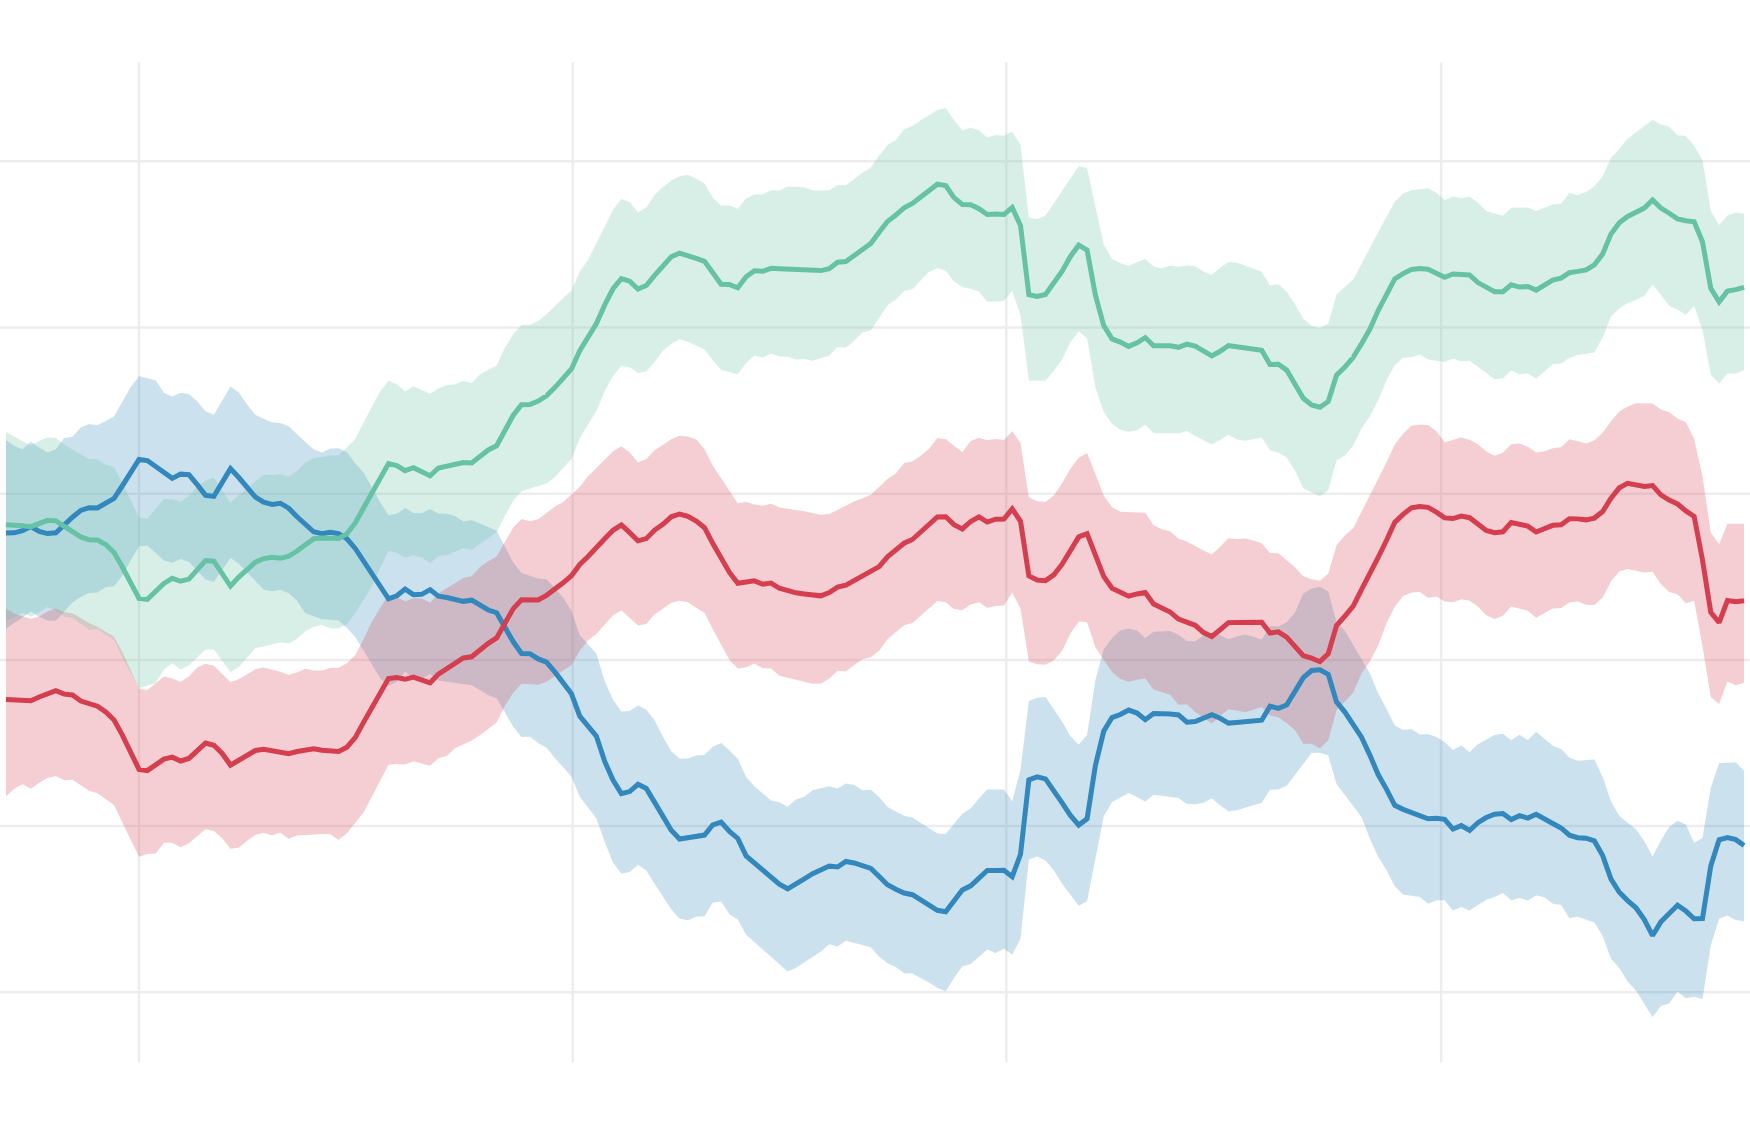
How popular are the parties?
The plot shows weekly levels of support in the form of predicted vote shares. To show or hide a party, click on it in the list above the plot. To show only a single party, double-click on it while it is visible. To show all parties, double-click on a hidden party.
The Labor Party (Ap), at 22.7 to 26.8%, is predicted to get the largest vote share, ahead of the Conservative Party (H), at 17.2 to 20.9%. The Socialist Left Party (SV) may see the largest gains compared to the last election, adding between 1.7 and 4.3 percentage points to its predicted vote share. The Conservative Party (H) may see the largest losses, dropping between 4.1 and 7.8 percentage points.
Who will get above the 4% threshold?
The plot shows the probability that a party would get above the 4% threshold if an election had been held during a given week.
The Liberal Party (V) currently has a 90.7% probability of getting more than 4% of the national vote. The equivalent probability for the Red Party (R) is 89.5%. For the Green Party (MDG) it is 88.6%, and for the Christian Democratic Party (KrF) 49.5%.
How many seats will each party get?
The plot shows weekly levels of support in the form of predicted parliamentary seats.
The Labor Party (Ap) is predicted to be the largest party in parliament, with 43 to 50 seats, ahead of the Conservative Party (H), at 30 to 38 seats. The Centre Party (Sp) may gain the most seats, adding 2 to 11 compared to the last election. The Conservative Party (H) may lose the most, obtaining 7 to 15 fewer seats.
How is party support geographically distributed?
The map shows the total predicted vote share for the conservative block at the next election. Move the marker over a district for details (on touch screens: tap). Click and drag to zoom. Double-click to return to the original position (on touch screens: tap with two fingers).
Vest-Agder may prove to be the most Right-leaning district in Norway, with a 45.8 to 52.6% predicted vote share for the conservative block at the election. Nord-Trøndelag could prove the most Left-leaning, with a 22.3 to 26% predicted vote share for the conservative block.
How do the polls look?
The reported date for each poll is the midpoint between the start and end of the data collection.
In addition to national polls, the plot shows the estimated trends of support in the population. Because the model corrects for differences between polls and actual results in previous elections, some trends are adjusted slightly up or down relative to the moving average of the polls.
To keep track of new polls, this project relies on Poll of polls and the project might not have been feasible without their effort to systematize the polls. The idea behind this project is to complement their contribution by going further in terms of modeling party support and predicting election results.
About this website
Further information about this site can be found here.